Overview
The BAT Analyzer tool is an interactive visualization tool for analyzing the structure of novels. It transforms your book's scene data into explorable graphs and charts, helping you understand character relationships, pacing patterns, and location usage at a glance.
Character Relationships
See which characters appear together and how strongly they're connected throughout the story.
Scene Flow
Trace the narrative path through scenes and chapters with visual connections.
Location Tracking
Identify hub locations, one-off settings, and how your story moves through space.
Pacing Metrics
Analyze chapter density using scene counts, character variety, and complexity scores.
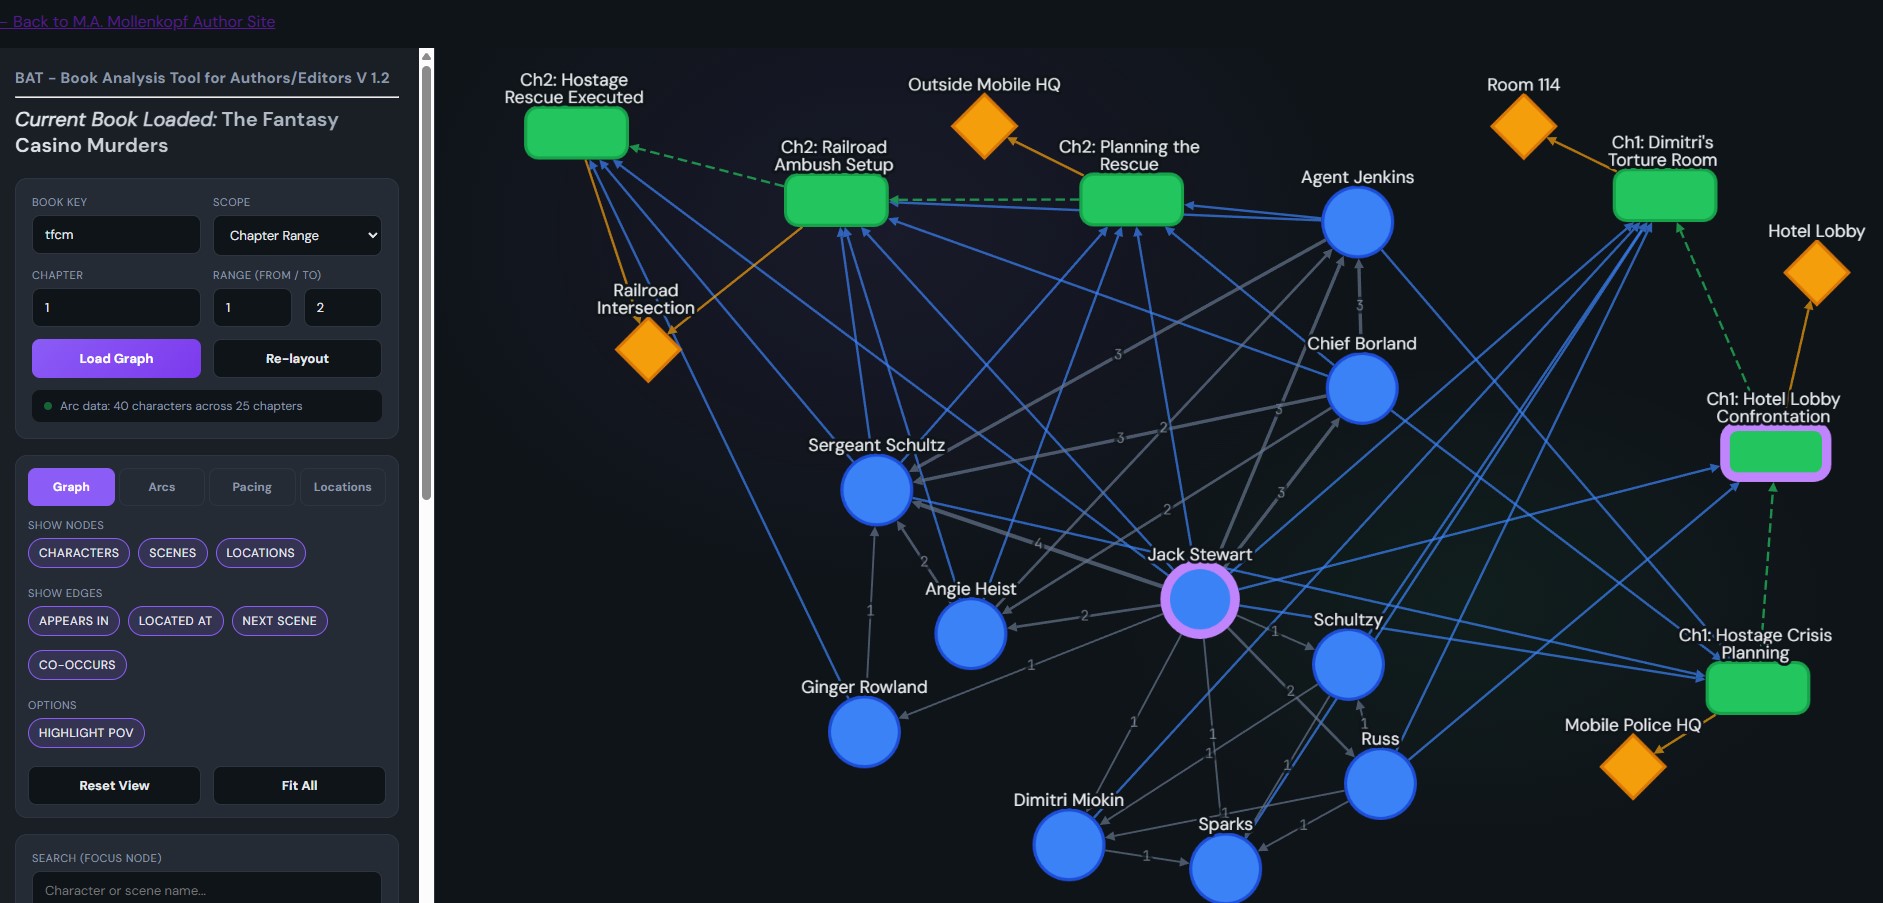
The BAT Graph interface with the graph view active
Graph View
The Graph View displays your book's structure as an interactive network diagram. Nodes represent characters, scenes, and locations, while edges show the relationships between them.
Node Types
| Node | Shape | Color | Description |
|---|---|---|---|
| Character | Circle | Blue | People in your story. POV characters have a purple border. |
| Scene | Rounded rectangle | Green | Individual scenes, labeled with chapter and scene name. |
| Location | Diamond | Orange | Places where scenes occur. |
Edge Types
| Edge | Meaning |
|---|---|
| Appears In | Connects a character to a scene they appear in. |
| Located At | Connects a scene to its location. |
| Next Scene | Shows narrative order (dashed line). |
| Co-Occurs | Connects two characters who appear in the same scene. Thicker lines = more co-appearances. |
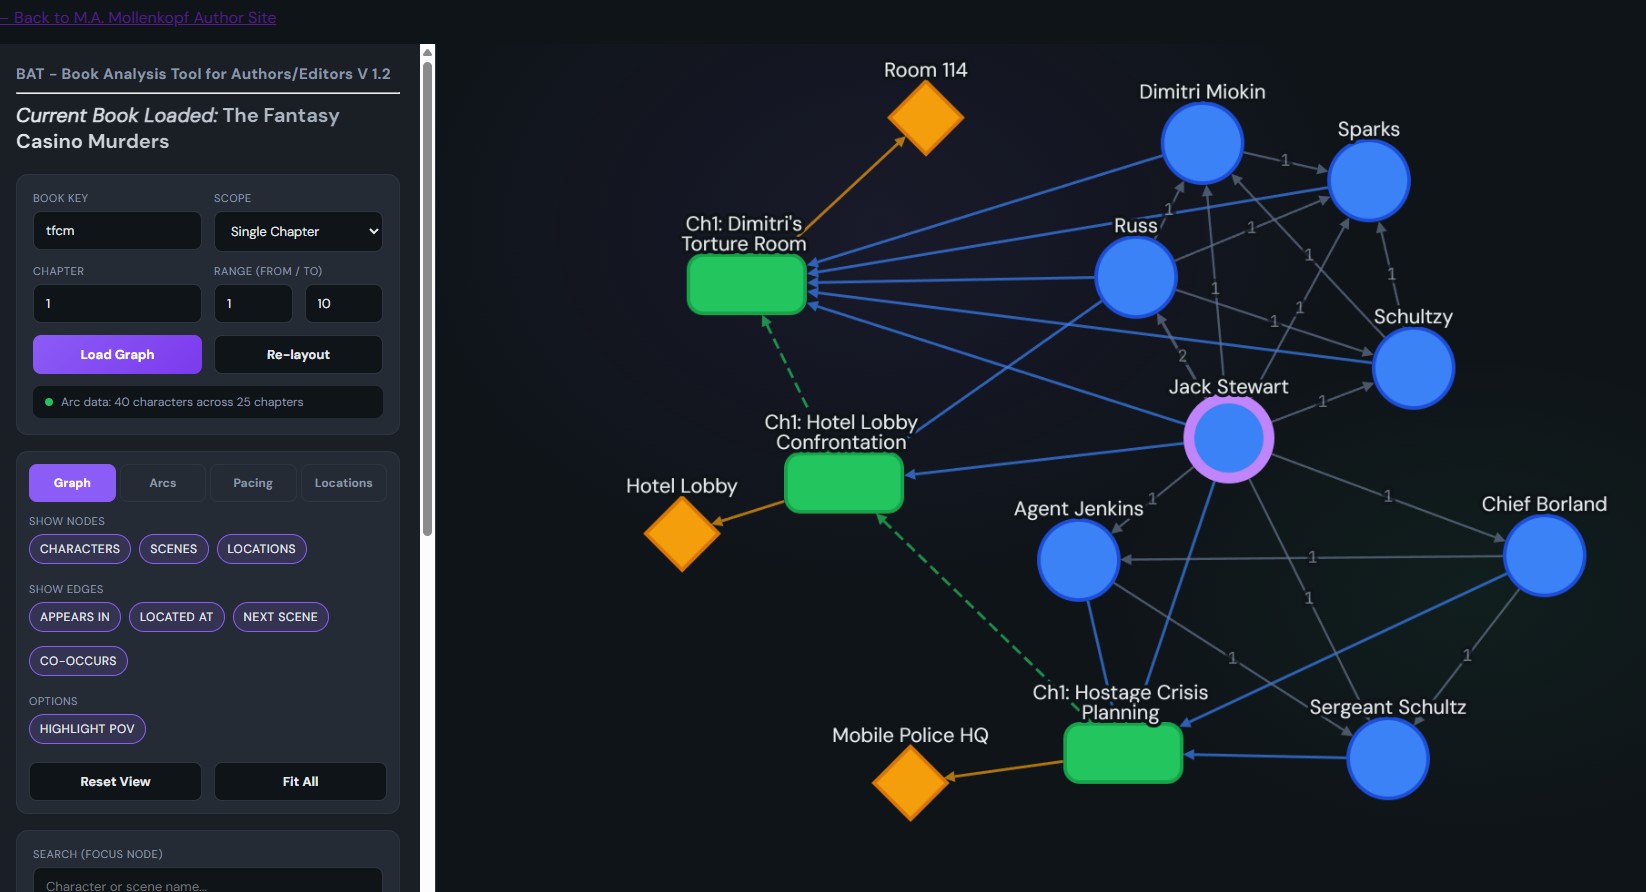
Character, scene, and location nodes connected by relationship edges
Controls
- Load Graph — Fetches data for the selected book and scope
- Re-layout — Reorganizes the graph with a force-directed algorithm
- Reset View — Restores all hidden nodes and edges
- Fit All — Zooms to show the entire graph
Use the checkboxes to show/hide specific node and edge types. Click any node or edge to see its details in the Selection Details panel.
Use the Search box to quickly find and focus on a specific character or scene. Matching nodes will be highlighted in orange.
Scene Navigator
The Scene Navigator panel lists all scenes in the current view, sorted by chapter and scene order. It provides a sequential way to step through your narrative and quickly jump to specific scenes in the graph.
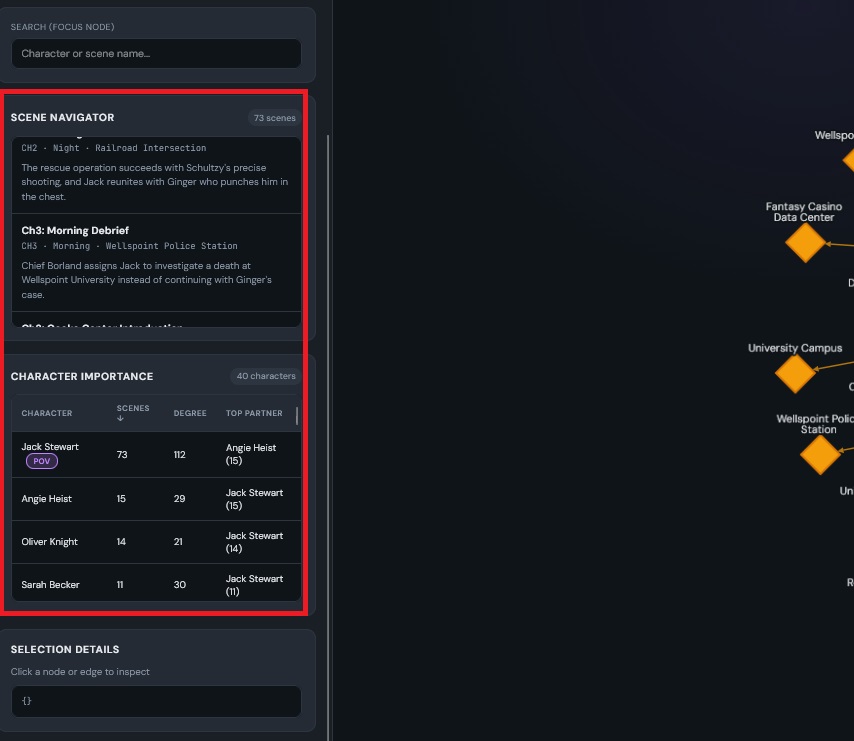
Scene list showing chapter, time, location, and summary for each scene
Scene Information
Each scene entry displays:
- Scene Label — The name or title of the scene
- Chapter Number — Which chapter the scene belongs to
- Time — Time of day when the scene occurs
- Location — Where the scene takes place
- Summary — A brief description of scene events (if available)
How to Use
- Click any scene to highlight it in the graph and view its full details
- Use it to step through your narrative in order
- The badge at the top shows the total scene count for the current scope
What to Look For
- Missing labels — Scenes with vague or missing names that need cleanup
- Time patterns — Does everything happen at night? Are there too many "morning" scenes in a row?
- Summary gaps — Empty summaries might indicate underdeveloped scenes
- Location repetition — Consecutive scenes in the same place might feel static
Use single-chapter scope to review one chapter at a time. This makes the scene list more manageable and helps you focus on chapter-level pacing.
Character Importance
The Character Importance panel ranks all characters by their structural significance in the story. It uses graph metrics to quantify how central each character is to the narrative.
Character rankings with scene count, degree, and top partner columns
Understanding the Metrics
| Column | What It Measures | What It Means |
|---|---|---|
| Scenes | Number of scenes the character appears in | Raw "screen time" — higher means more presence in the story |
| Degree | Total graph connections (scenes + co-occurrences) | Overall connectivity — characters who interact widely have higher degree |
| Top Partner | The character they appear with most often | Key relationship — reveals primary pairings and dynamics |
How to Use
- Click column headers to sort by that metric
- Click any row to focus on that character in the graph
- POV characters are marked with a purple "POV" badge
What to Look For
- Protagonist ranking — Your main character should typically rank highest in scenes. If not, consider whether they're getting enough page time.
- High degree, low scenes — These "connector" characters appear briefly but interact with many others. They might be catalysts or ensemble players.
- Top Partner mismatches — Is your love interest actually paired with the protagonist? If the sidekick's top partner is someone other than the hero, that relationship might be underdeveloped.
- Isolated characters — Characters with very low degree or zero co-occurrences might be disconnected from the main story. Consider whether they need more integration or can be cut.
- Unexpected pairings — Sometimes the data reveals relationships you didn't consciously emphasize. These can be opportunities or problems.
Compare the Top Partner column across your main cast. In a well-connected story, important characters should have varied top partners, not all pointing to the same person.
Character Arcs
The Character Arcs view shows when each character appears throughout your book using a timeline visualization. This helps identify character introduction patterns, disappearances, and gaps.
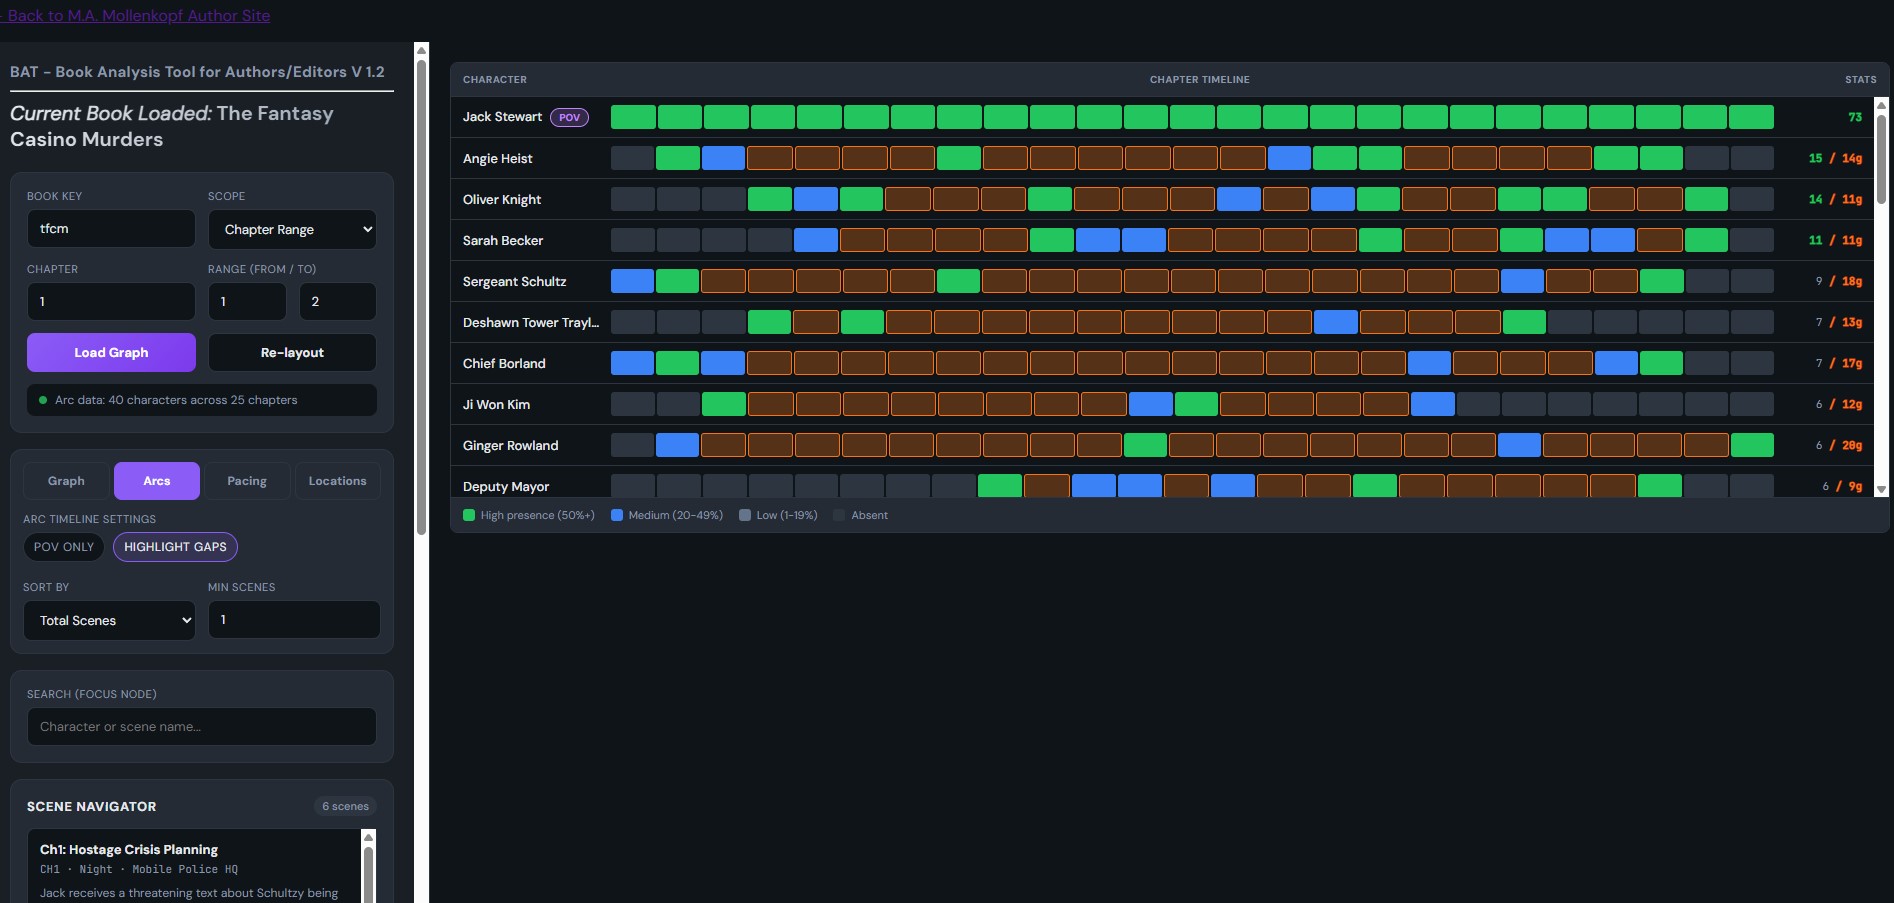
Character presence across chapters — darker bars indicate higher scene participation
Reading the Timeline
Each row represents a character. The horizontal bars show their presence in each chapter:
- High presence (50%+) — Character appears in half or more of the chapter's scenes
- Medium (20-49%) — Moderate presence
- Low (1-19%) — Brief appearance
- Absent — Character doesn't appear
Gap Detection
When "Highlight Gaps" is enabled, chapters where a character is absent between their first and last appearance are highlighted with an orange border. This helps identify characters who disappear mid-story and might need attention.
Sort by "Gap Count" to find characters with the most unexplained absences. These might be continuity issues worth reviewing.
Pacing Analysis
The Pacing view analyzes chapter density using metrics derived from your scene data. While it doesn't measure word count directly, it uses proxy metrics that correlate with chapter complexity and pacing.
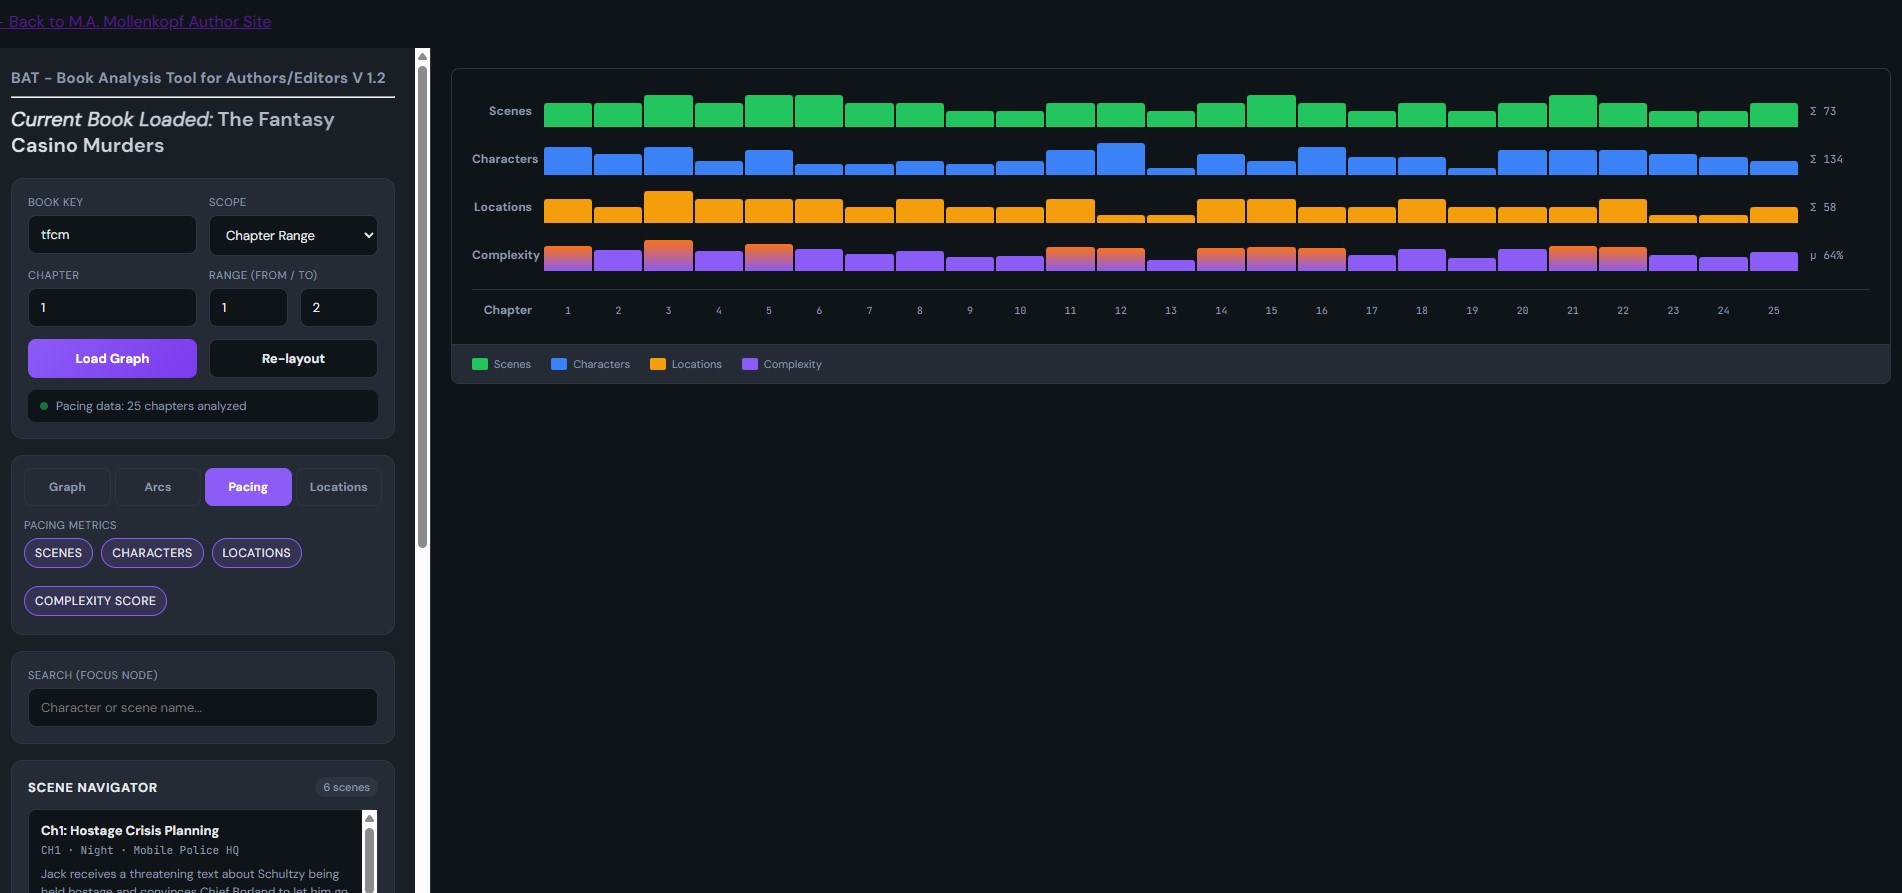
Four metrics shown across all chapters — taller bars indicate higher values
Metrics Explained
| Metric | What It Measures | Pacing Signal |
|---|---|---|
| Scenes | Number of scenes in the chapter | More scenes = more cuts/transitions = faster perceived pace |
| Characters | Unique characters appearing | More characters = busier chapter, ensemble dynamics |
| Locations | Unique locations used | More locations = more movement, visual variety |
| Complexity | Weighted composite score (0-100%) | Overall chapter density combining all factors |
Using Pacing Data
Look for patterns and outliers:
- Consistent heights — Even pacing throughout
- Gradual increase — Building tension toward climax
- Sudden spikes — High-action chapters (battles, reveals)
- Valleys — Quieter, introspective chapters
- Outliers — Chapters that might need rebalancing
Hover over any bar to see exact values. Compare adjacent chapters to ensure intentional pacing changes rather than accidental imbalances.
Location Heat Map
The Location Heat Map shows where your story takes place across all chapters. Each row is a location, and the cells show how many scenes occur there in each chapter.
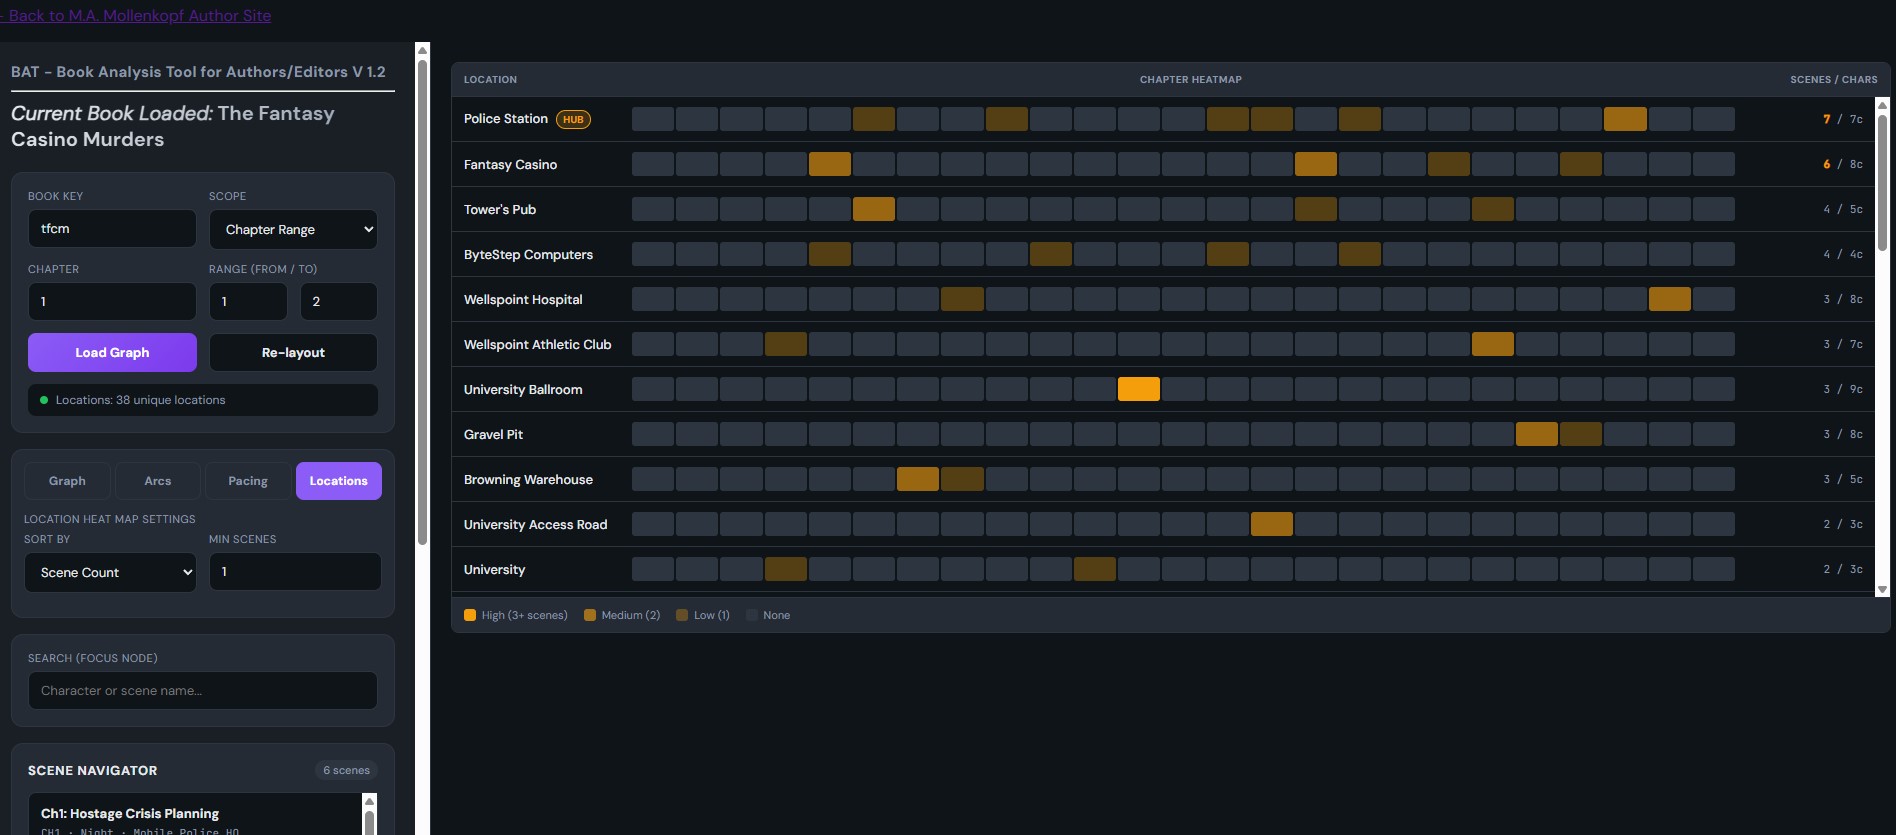
Location usage across chapters — brighter orange indicates more scenes
Reading the Heat Map
- Bright orange (3+ scenes) — Heavy use in that chapter
- Medium (2 scenes) — Moderate use
- Light (1 scene) — Brief appearance
- Dark — Location not used
Hub Locations
Locations appearing in 5 or more chapters are marked with a HUB badge. These are your story's anchor points — recurring settings that readers will become familiar with.
Sorting Options
- Scene Count — Most-used locations first
- Chapter Spread — Locations appearing in the most chapters
- Character Variety — Locations visited by the most different characters
- Name — Alphabetical order
Use "Min Scenes" to filter out one-off locations and focus on recurring settings. Set it to 3+ to see only significant locations.
Tips & Tricks
Scope Selection
Use the Scope dropdown to control how much of the book to analyze:
- Single Chapter — Focus on one chapter's internal structure
- Chapter Range — Analyze a specific section (e.g., Act 2)
- Whole Book — See the complete picture
Finding Story Issues
| Issue | Where to Look |
|---|---|
| Disappearing character | Character Arcs → Sort by Gaps |
| Pacing problems | Pacing → Look for unexpected spikes/valleys |
| Overused location | Locations → Sort by Scene Count |
| Isolated character | Graph View → Character with few Co-Occurs edges |
| One-note setting | Locations → Filter to Min Scenes = 1 |
Graph Navigation
- Zoom — Mouse wheel or pinch gesture
- Pan — Click and drag on empty space
- Select — Click a node or edge
- Focus — Click a character in the table or arc view